Graphical Path Method

Innovative algorithms for planning and scheduling

Innovative Vision

The Graphical Path Method (GPM) is a fundamental advancement in how construction projects are planned, analyzed, and managed. Developed by PMA, GPM addresses core limitations in traditional Critical Path Method scheduling, including static logic, manual updates, and float visibility gaps, through a dynamic real-time approach that keeps schedules accurate as conditions change.

For owners and project teams, GPM means schedules that stay accurate under real-world pressure without constant manual correction. Where traditional methods lose reliability as projects evolve, GPM adapts in real time, giving owners a clearer and more trustworthy picture of where their project stands at every phase.

GPM is backed by nine patents with additional capabilities in development, reflecting more than 15 years of continuous investment in scheduling innovation. It is the methodology behind NetPoint and the foundation of PMA’s position as a technology leader in project controls and scheduling.

Knowledge Base

Case Studies

Presentations

Publications

Videos

Discover the future of project planning using the Graphical Path Method.​

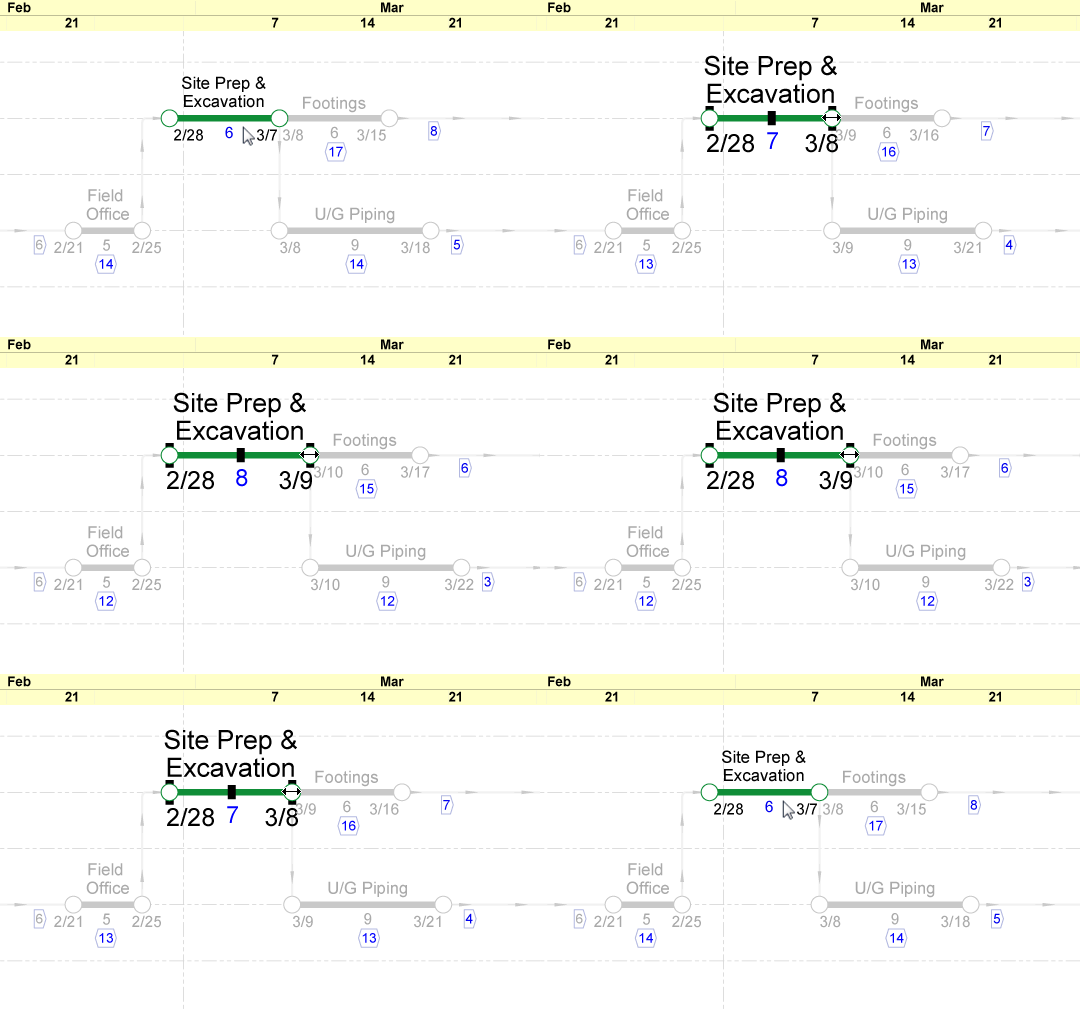
A network being updated as an activity is moved. Highlighted in blue: durations, link gaps, and total floats.

Real-time calculations

When an activity is moved within a network, its relational logic can break down. GPM heals these relationships by propagating the change throughout the network in real-time. This automatic correction is known as ‘self-healing’ and the result is dynamic preservation of logic. Since GPM doesn’t rely on a database-driven scheduling engine–dates, durations, float attributes, the critical path, and resource profiles all continuously refresh as the network is modified. These real-time calculations provide invaluable information as schedules are built.

Planned-dates

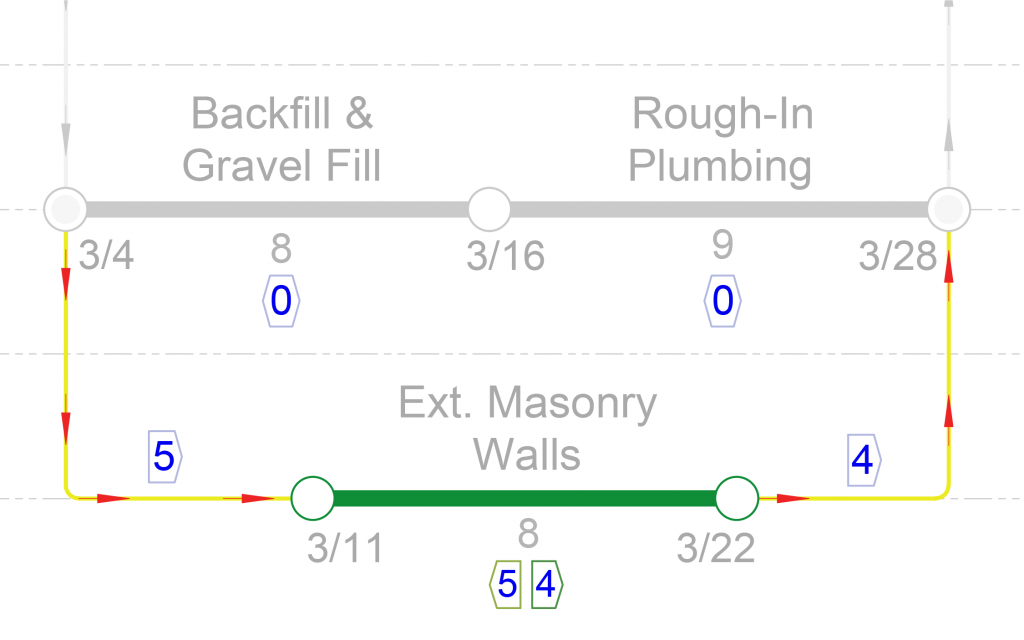
GPM omits the early start bias inherent with CPM, permitting activities to be placed anywhere within their total float range, without constraining float. This is achieved with the introduction of Drift: the number of time units an activity can gain before advancing the start of the project. In a GPM network, Drift plus GPM Float is equivalent to CPM total float. With the ability to draw and stretch activities in either direction, planned dates allow projects to be planned forward or backward, allowing schedules to be built more naturally and with more flexibility than CPM.

Ext. Mason Walls shown in between early dates and late dates without a constraint. Highlighted in blue: link gaps, total floats, & drift and float.
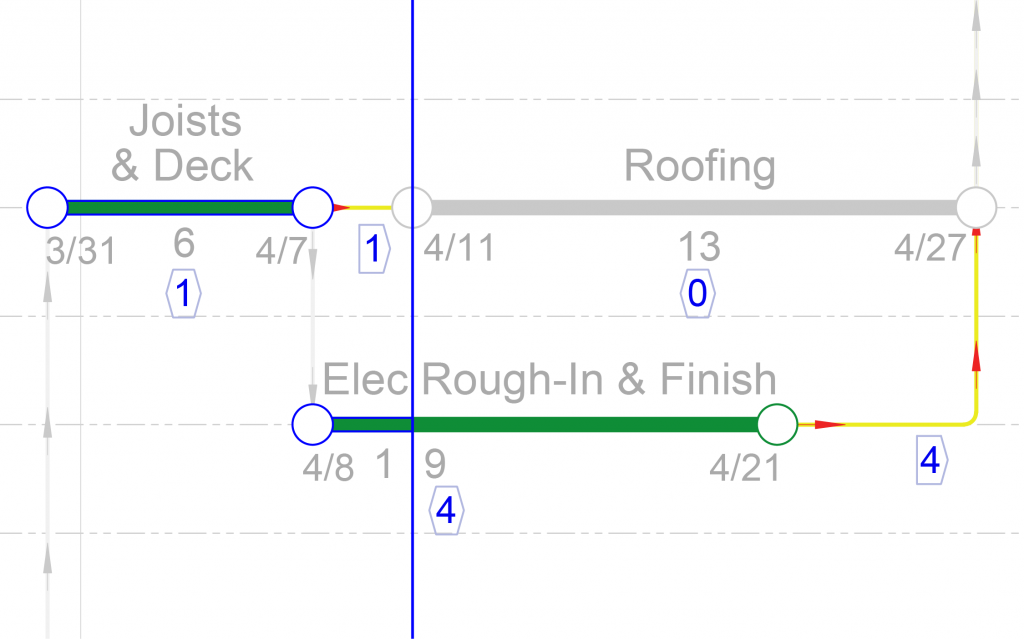
Joists & Desk completed with 1 day of forensic float. Highlighted in blue: link gaps, total floats, & forensic total float.

Forensic float

In CPM, the ability to calculate floats is lost when actual dates are entered. Not only does GPM retain this ability, but it’s inherent to the GPM algorithm. Once activities are actually completed, the meaning of float is interpreted as hypothetical: how much could an activity have been delayed? In GPM, this value is referred to as forensic float, and it continues to refresh even as schedule progress updates to the right of the data date. This can be particularly useful when analyzing a schedule for delays after the project has started or finished.