NetPoint Features

User-Friendly Experience

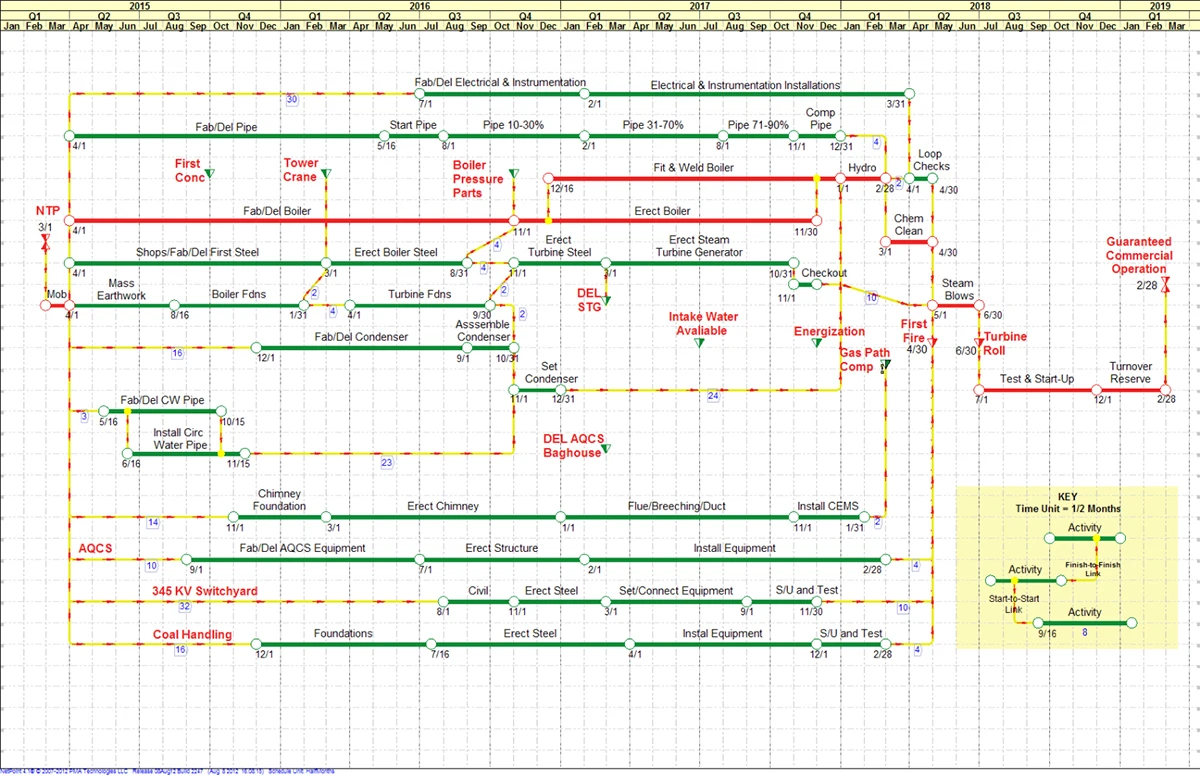
NetPoint combines the power of the GPM algorithm with a highly visual, user-friendly interface. The result is a uniquely flexible project management scheduling software. Empower your team members and project managers to plan forward and backward, build schedules faster, and communicate the project timeline more clearly than ever.

Planned Dates

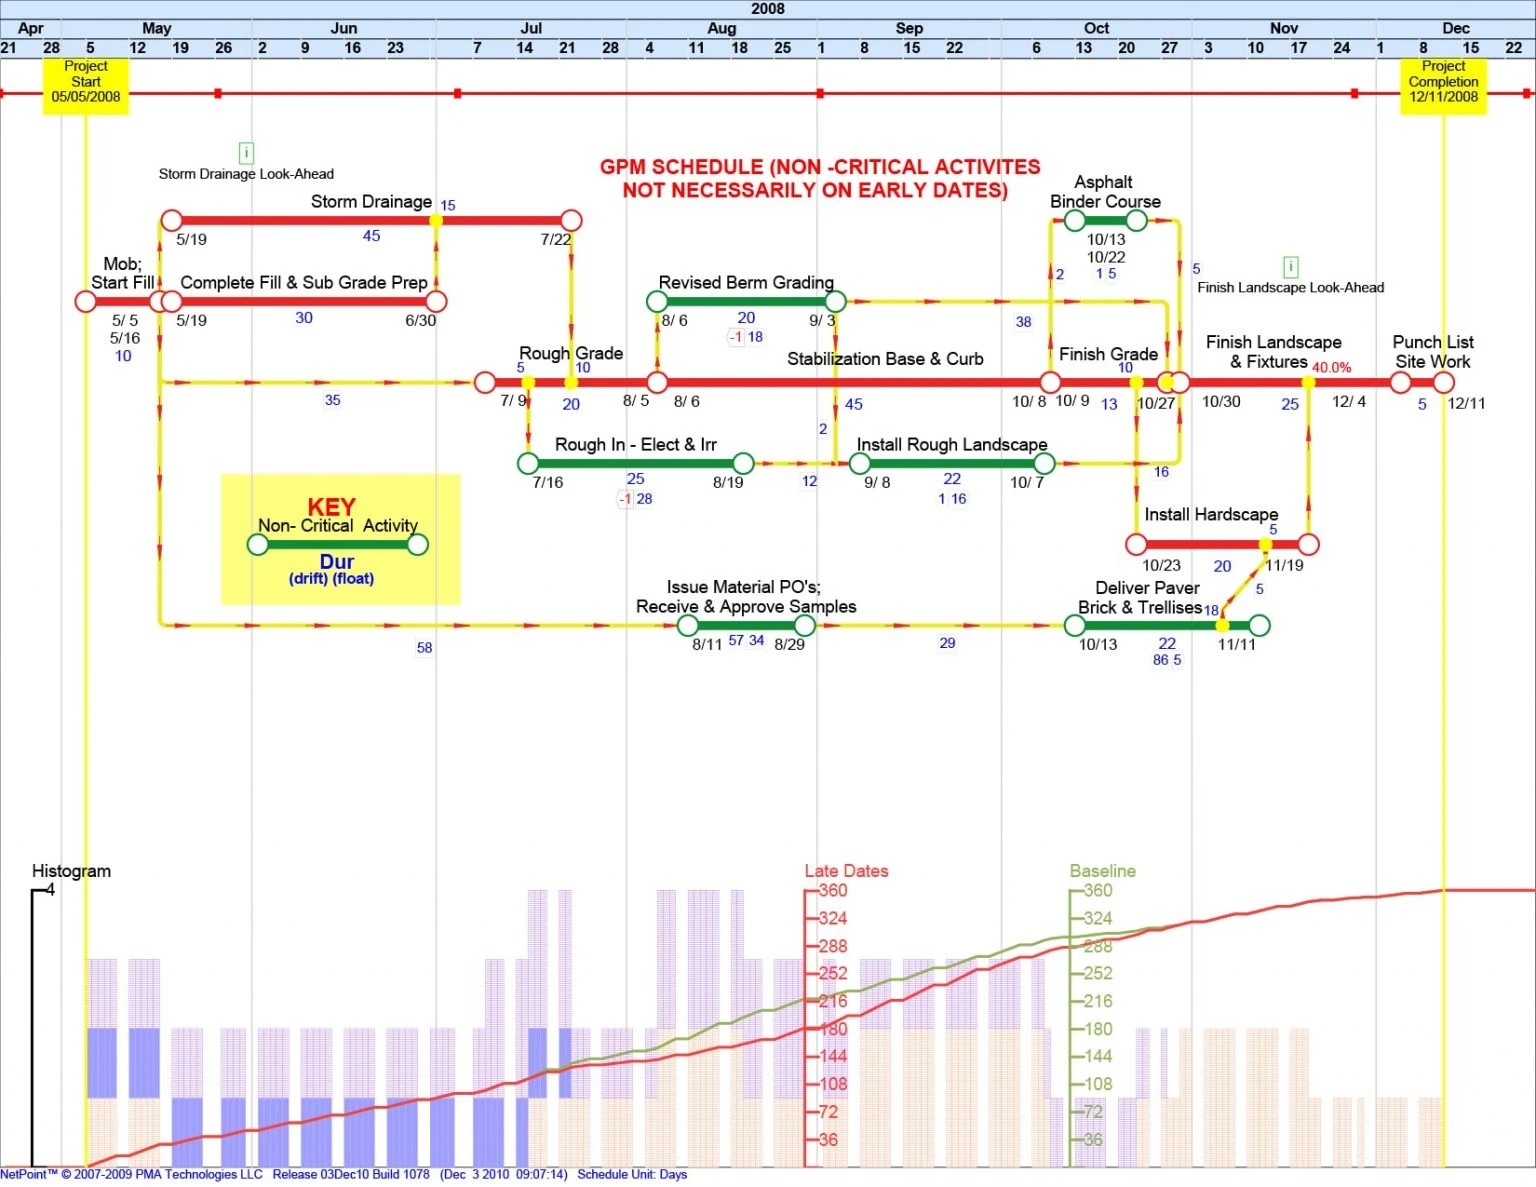
Build a construction project schedule that reflects real-world conditions by placing activities anywhere within their total float range, without constraining float.

Forensic Float

Since GPM doesn’t rely on early and late dates for network calculations, float values are preserved left of the data date—particularly useful in retrospective schedule analysis.

And More

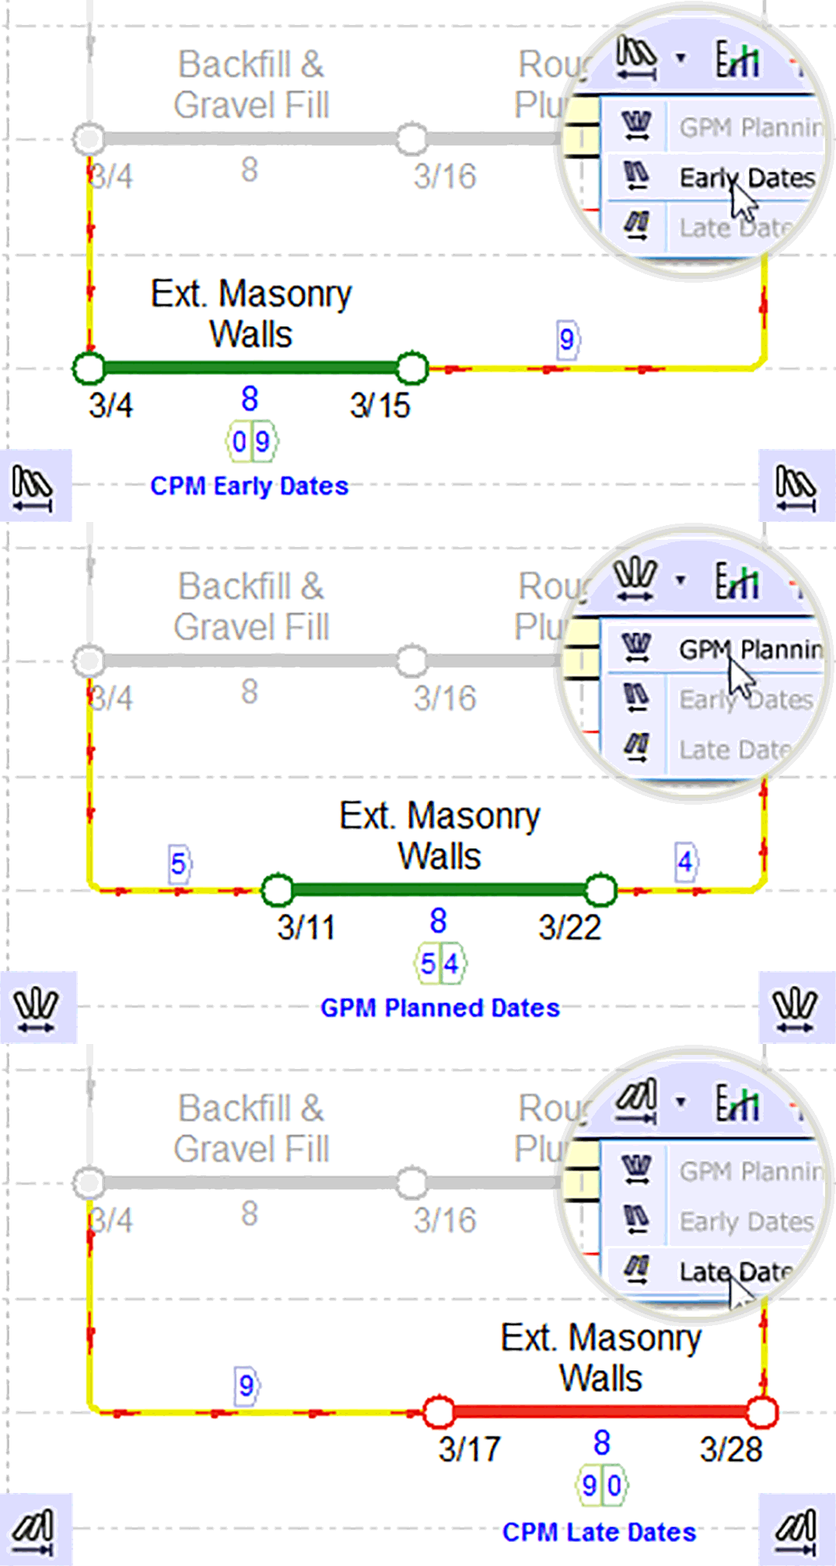
Toggle date modes (early, planned, late) Real-time schedule calculations Self-healing network logic As-built critical path

Superior Graphical Interface

The flexibility of NetPoint’s graphical interface makes project planning far more natural and intuitive for project managers and team members. The results are project schedules that stakeholders and the whole project team can understand.

Global Edit Mode

A fast method for optimizing schedule appearance. GEM™ activates all data elements on the canvas for simultaneous positioning and formatting.

PolyTime®

Choose the time unit best suited to your project, from minutes up to years. Depict the appropriate timescale on a summary schedule, or use it for micro-planning time-sensitive turnarounds.

And More

Multiple activities per line
Object styles
Real-time canvas interaction

Dynamic & Responsive Project Planning

Gone are the days of pressing F9 and waiting for the CPM schedule to calculate and update. GPM’s real-time and self-healing rules, dates, durations, logic relationships, and the critical path refresh in real-time, as the schedule is modified. It’s never been easier for project managers to anticipate critical activities, highlight the critical path for everyone to see, and evaluate alternative planning or resource management scenarios on the fly.

Backward Planning

Since activities can be drawn and stretched in either direction, the late-dates mode allows projects to be instinctively planned backward from the project end date.

Visual Resource Modeling

By plotting histogram graphs and curves directly underneath activities, resource-leveling becomes a truly interactive and engaging exercise.

And More

Dynamic critical path analysis
Multiple calendars
Custom non-work days
Weather modeling

Robust Tools for Schedule Maintenance

Use NetPoint to update and maintain the schedule during project execution and produce reports and timelines that convey up-to-date project status to key stakeholders. The visual interface makes it easy to review the schedule network and make adjustments so that a record of the actual work sequence and even the critical path can be maintained.

Schedule Updating

Insert a data-date and receive immediate visual feedback on the activities falling behind schedule. Watch the notification counter decrease as activities are actualized or updated to reflect changes in work.

Target Comparisons

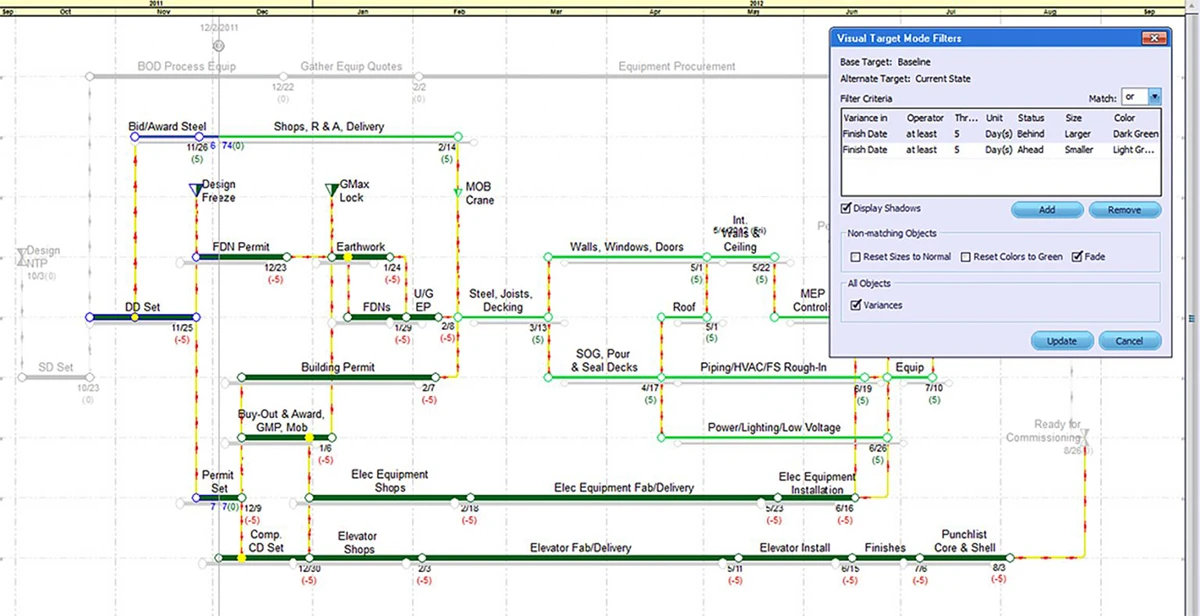
Establish a baseline schedule, commit project updates, and compare variances between dates, durations, and float values. Export to Excel for more flexible analysis.

And More

Constraint flags
Activity filters

Explore NetPoint’s Newest Features

Header/Footer

Augment Schedules with Key Information
Add images, insert schedule data, build tables, and add legends automatically – all in dedicated areas above and below the canvas.

Resizeable Timescale

The perfect size whether printing or projecting
Choose any text size for the timescale, which will adjust proportionately. Perfect when using a high resolution projector or printing to PDF.

Saveable Filters

Filter schedules faster and easier
Save filter criteria and use them in other schedules or share them with other people, avoiding the need to recreate them from scratch.

P6 Import Filtering

Import only what you need for better performance
Search and import subsets of XER files for performing what-if analyses or reporting by phase.

Longest Path Highlighting

Identify what drives your project's completion date.

Schedules can have many critical paths. Choose to display only the true longest path or all critical activities for a clearer view of what controls your finish date.