ASK THE EXPERT
Ernesto Toxqui Damian has been with PMA for ten years and is a certified e-Builder partner with a background in software engineering. He is an experienced software developer, business analyst, and project manager with hands-on experience in Java, JavaScript, Structured Query Language (SQL), Visual Basic for Applications (VBA), and business intelligence tools.
We spoke with Ernesto about Power BI and data dashboards for a wide variety of projects. He gives an overview of Power BI, explains what it takes to use it effectively, and describes how it gives owners greater insight into their projects.

How is Power BI used in project management?
Power BI is a Microsoft product; “BI” stands for business intelligence. Its first job is to report on the critical aspects of a project. A project manager needs to know the project’s health. Is it progressing? Is it performing well in critical areas such as cost and schedule? Power BI produces outputs that show project progress, so you can compare actual performance with the plan and correct course when something goes off track.
Power BI also lets you interact with your reports and explore the data. Say you’re looking at a schedule and see that it’s falling behind. With one click, you can see which activity is behind, who is responsible, and which metrics and project phase are affected. You can roll information up into a summary or drill down into the detail.
How is Power BI different from other tools to show the progress of a project?
Because it’s a Microsoft product, an organization that already uses Excel, Word, Access, and PowerPoint likely has access to Power BI. That’s a major advantage. The organization doesn’t have to buy additional licenses, and the tool is relatively easy to implement.
Were you surprised about the versatility of business intelligence dashboards and how they impact project management?
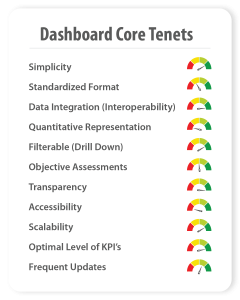
Yes. Project managers, program managers, and boards of directors love them. Dashboards are high level, use color for visual impact, and present live information, so the content is meaningful to stakeholders.
A narrative project report is just text. Sometimes it tells the story, and sometimes it doesn’t. When you add graphs and charts and let readers click into them, they can slice, group, and roll up the information. You can show cost, schedule, and other areas of project management in detail, combining information from multiple sources instead of relying on a single spreadsheet.
Spreadsheets are a common format for exchanging data, but Power BI can also draw on comma-separated values (CSV) files, Microsoft Access databases, SharePoint, Oracle databases, and Microsoft SQL Server databases. It can also draw on the core databases behind systems such as Primavera P6. It can combine sources in Extensible Markup Language (XML), CSV, and JSON formats into a single report or dashboard. One dashboard can contain multiple tabs, each devoted to a specific area of project management.
How have you used Power BI to report live data?
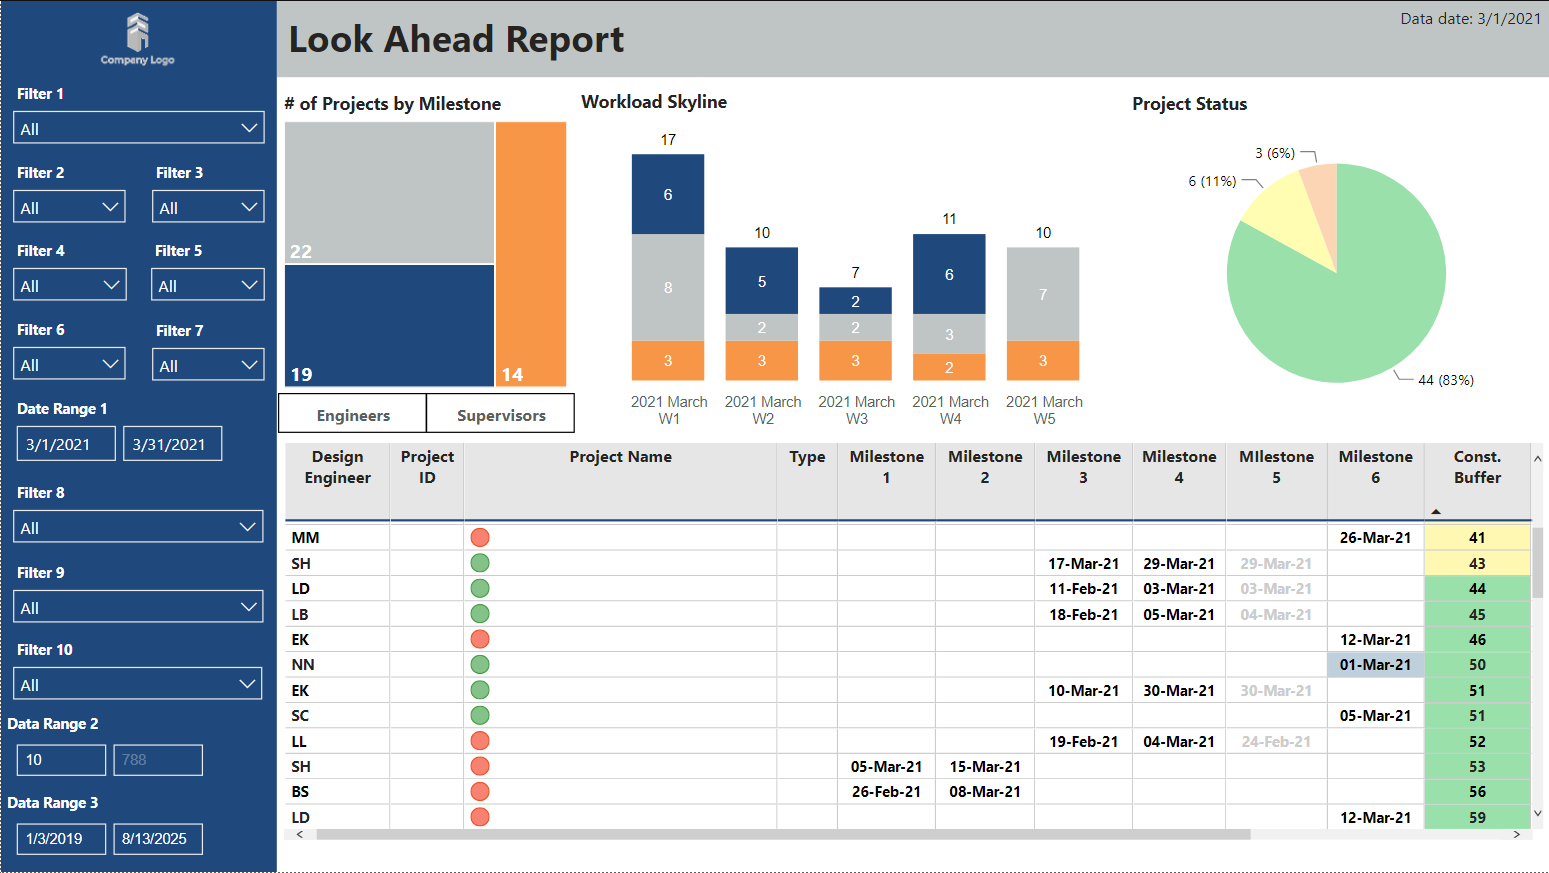
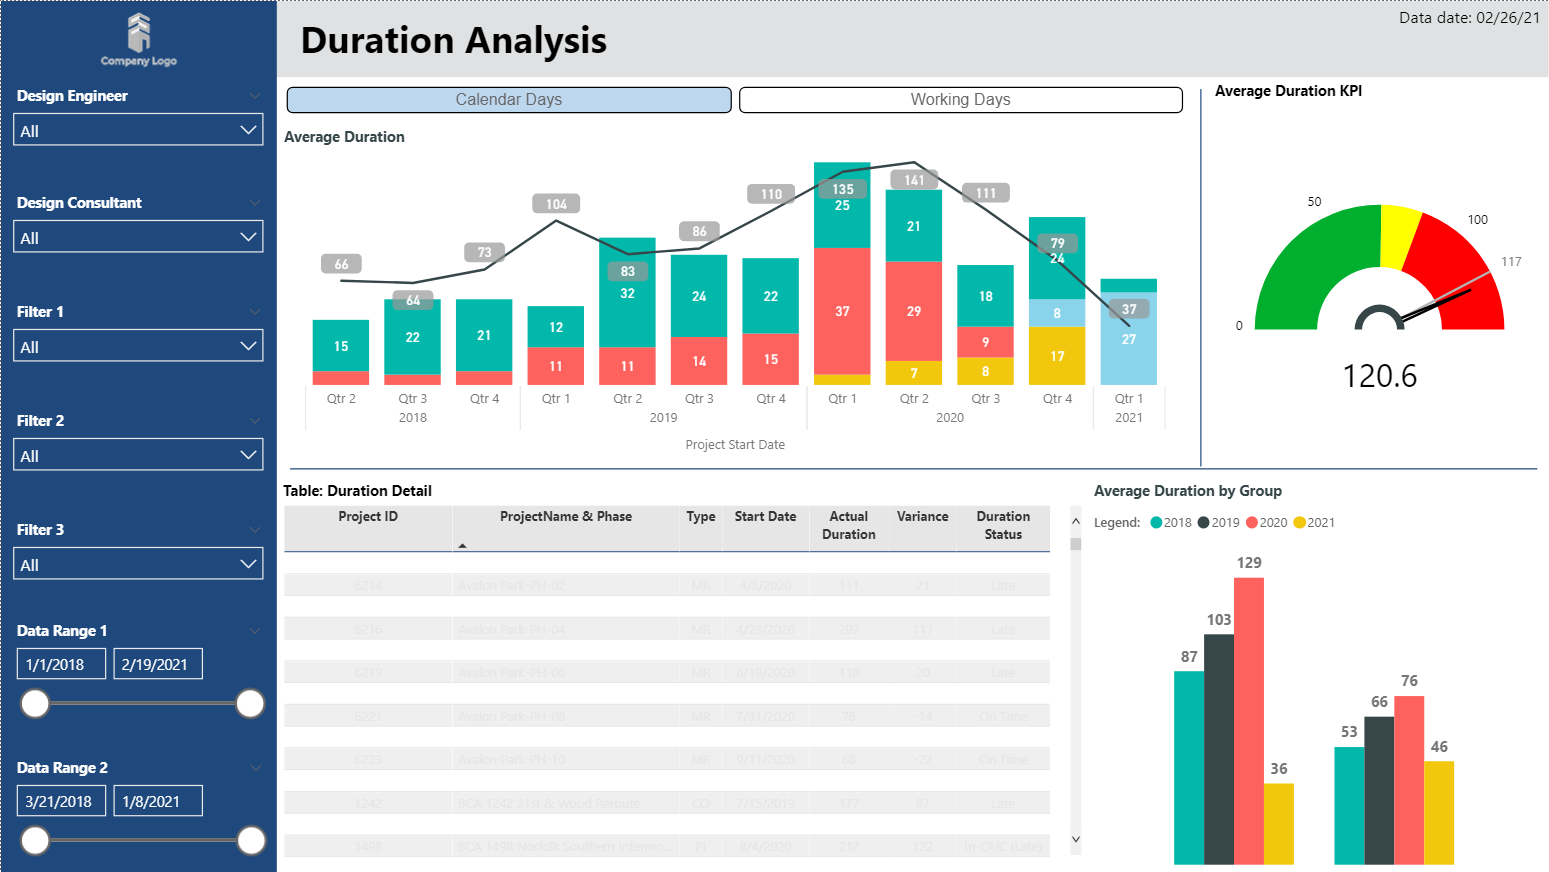
We now use Power BI for all kinds of reports, and the results have been great. There is strong demand across many areas, and PMA has built a niche in this work. Clients benefit because they likely already own Power BI at no additional cost, and we help them get more from a tool they already have.
A principal theme at PMA, especially in our Long Beach office, is that we are “tool agnostic.” We adapt to each client’s systems and needs. We have worked with Microsoft SQL Server Reporting Services, Oracle BI Publisher, and Oracle Analytics.
Have you ever used NetPoint as the scheduling tool to bring data into Power BI?
Yes. Power BI isn’t limited to one software application. NetPoint is PMA’s trademarked project management software. It connects with Power BI because both can exchange information in multiple formats. I’ve worked specifically with NetRisk, part of the NetPoint suite, and we have built dashboards dedicated to risk.
What business intelligence dashboard skills should project managers look for?
The skills depend on the role. You need someone who can develop dashboards, someone with business knowledge of the industry or client, and someone with technical knowledge of the systems the data comes from. You also need to identify the end users.
End users may include project managers, program managers, directors, boards of directors, and other senior leaders. Power BI dashboards can be built for each of these audiences.
Most dashboards are designed for end users who need a high-level view, but they also serve people working hands-on in the project. For example, a dashboard can serve as a quality assurance check to confirm the following:
- The data entered is correct.
The project ID or number entered is correct.
The cost and schedule are connected.
No activity has been left out, such as one that carries a cost but doesn’t appear in the schedule.
These quality assurance dashboards are usually aimed at a specific role, such as the scheduler or the cost engineer.
Other dashboards are designed for senior end users. A program director reviewing a portfolio, for instance, wants a summary of the projects rather than project-level detail. If something catches the director’s eye, though, a click reveals the detail. Why is this project having trouble? Why isn’t it performing as expected? We tailor each dashboard to the user’s role and position.
Building a dashboard takes a team. One person is the developer, who creates the data visualizations and connects the data sources. That person needs technical skill but, above all, needs to understand the business rules.
What do I mean by business rules? For cost, it means knowing which system holds the cost data and in what format. For project IDs, it means knowing the client’s conventions:
- Does it use only digits?
- How many digits does it use, or what combination of letters, dashes, and numbers?
- Does it use a baseline schedule?
- How does it use baselines?
The team also needs a database expert. This person knows how to connect to those systems and retrieve information, and can write SQL statements and work with XML, CSV, and JSON formats.
Roles can also be combined. Highly skilled people can wear several hats. The person with system access may also know the business rules, or those may be two different people. As a rule, though, developing a dashboard and consuming dashboard data are separate functions.